The Need
Hunger in Southwest Florida
Across Charlotte, Collier, Glades, Hendry, and Lee counties, neighbors of every kind don’t always know where their next meal is coming from. Here’s what that looks like, county by county — and how Harry Chapin Food Bank responds.
Five Counties, One Region
The Need Looks Different Across Southwest Florida
Explore the map below to see how food insecurity varies across Charlotte, Collier, Glades, Hendry, and Lee counties.
Food insecurity in Southwest Florida
Explore our five-county service area
Explore overall and child food-insecurity estimates across Harry Chapin Food Bank’s five-county service area.
Map shading represents overall food insecurity. Child food-insecurity estimates are provided in each county’s details.
Choose a county
Five-county geographic view
Loading the local county map.
Overall food-insecurity rate
- 13.0%–14.9%
- 15.0%–17.9%
- 18.0%–20.9%
Boundary
- HCFB five-county service area
COMMUNITY NEED
Southwest Florida community
County FIPS:
Approved five-county community estimates
- Overall food insecurity
- 14.3%
- People experiencing food insecurity
- 209,780
- Child food insecurity
- —
- Children experiencing food insecurity
- —
Additional county context
- Cost per meal
- —
The source flags the local meal-cost estimate as imputed.
Feeding America, Map the Meal Gap 2026 · 2024 data
Food access
11%
of the five-county area’s 2010 population had low income and lived beyond USDA’s large-retailer access threshold.
47 of 285 published, populated USDA census tracts met the criteria.
USDA’s threshold is more than 1 mile in urban areas or 10 miles in rural areas from a supermarket, supercenter, or large grocery store.
USDA ERS Large Retailer Access Map: 2019 retailers, 2010 population and tracts, and 2014–18 income inputs.
Compare all five counties View overall and child food-insecurity estimates.
Swipe or scroll horizontally to view all columns.
| County | Overall rate | Food-insecure people | Child rate | Food-insecure children |
|---|---|---|---|---|
| Charlotte County | 13.6% | 27,430 | 19.8% | 4,680 |
| Collier County | 13.4% | 53,370 | 19.6% | 12,740 |
| Glades County | 17.5% | 2,200 | 21.1% | 350 |
| Hendry County | 19.9% | 8,450 | 20.9% | 2,210 |
| Lee County | 14.5% | 118,330 | 20.3% | 28,500 |
“Food desert” is a commonly used term for communities where accessing affordable, nutritious food may be difficult. This layer follows the terminology and classifications in USDA’s Large Retailer Access Map (2019 retailers, 2010 population and tracts, 2014–18 income inputs). This map explains community conditions and is not a pantry locator. To locate food assistance, use Find Food.
Not One Story
Who Experiences Food Insecurity
Food insecurity looks different from one neighbor to the next. It isn’t limited to any single household type, and it doesn’t mean the same thing for everyone it touches.
- Families with Children Child food insecurity is often higher than a county’s overall rate — see each county’s child estimate in the map above.
- Seniors Some older neighbors on fixed incomes weigh food against medicine, housing, and other rising costs.
- Working Households Many neighbors who turn to food assistance are employed — food insecurity is not only about unemployment.
- Neighbors Facing a Temporary Crisis A job loss, a medical bill, or a storm can suddenly put food out of reach for a household that has never needed help before.
Beyond the Numbers
Why Access Is Complicated
“Food desert” is a commonly used term for communities where accessing affordable, nutritious food may be difficult. Our map includes an optional “Low food access areas” layer (often called food deserts) showing where this may be harder. This layer follows the terminology and classifications in USDA’s Large Retailer Access Map (2019 retailers, 2010 population and tracts, 2014–18 income inputs).
Distance & Transportation
How far the nearest grocery store is, and whether reliable transportation is available.
Household Costs
The local cost of living, and how far a household’s budget stretches.
Food Availability
Whether affordable, nutritious food is actually close by.
Changing Circumstances
A job loss, a medical event, or reduced hours can shift things quickly.
A Regional Response
How Harry Chapin Food Bank Responds
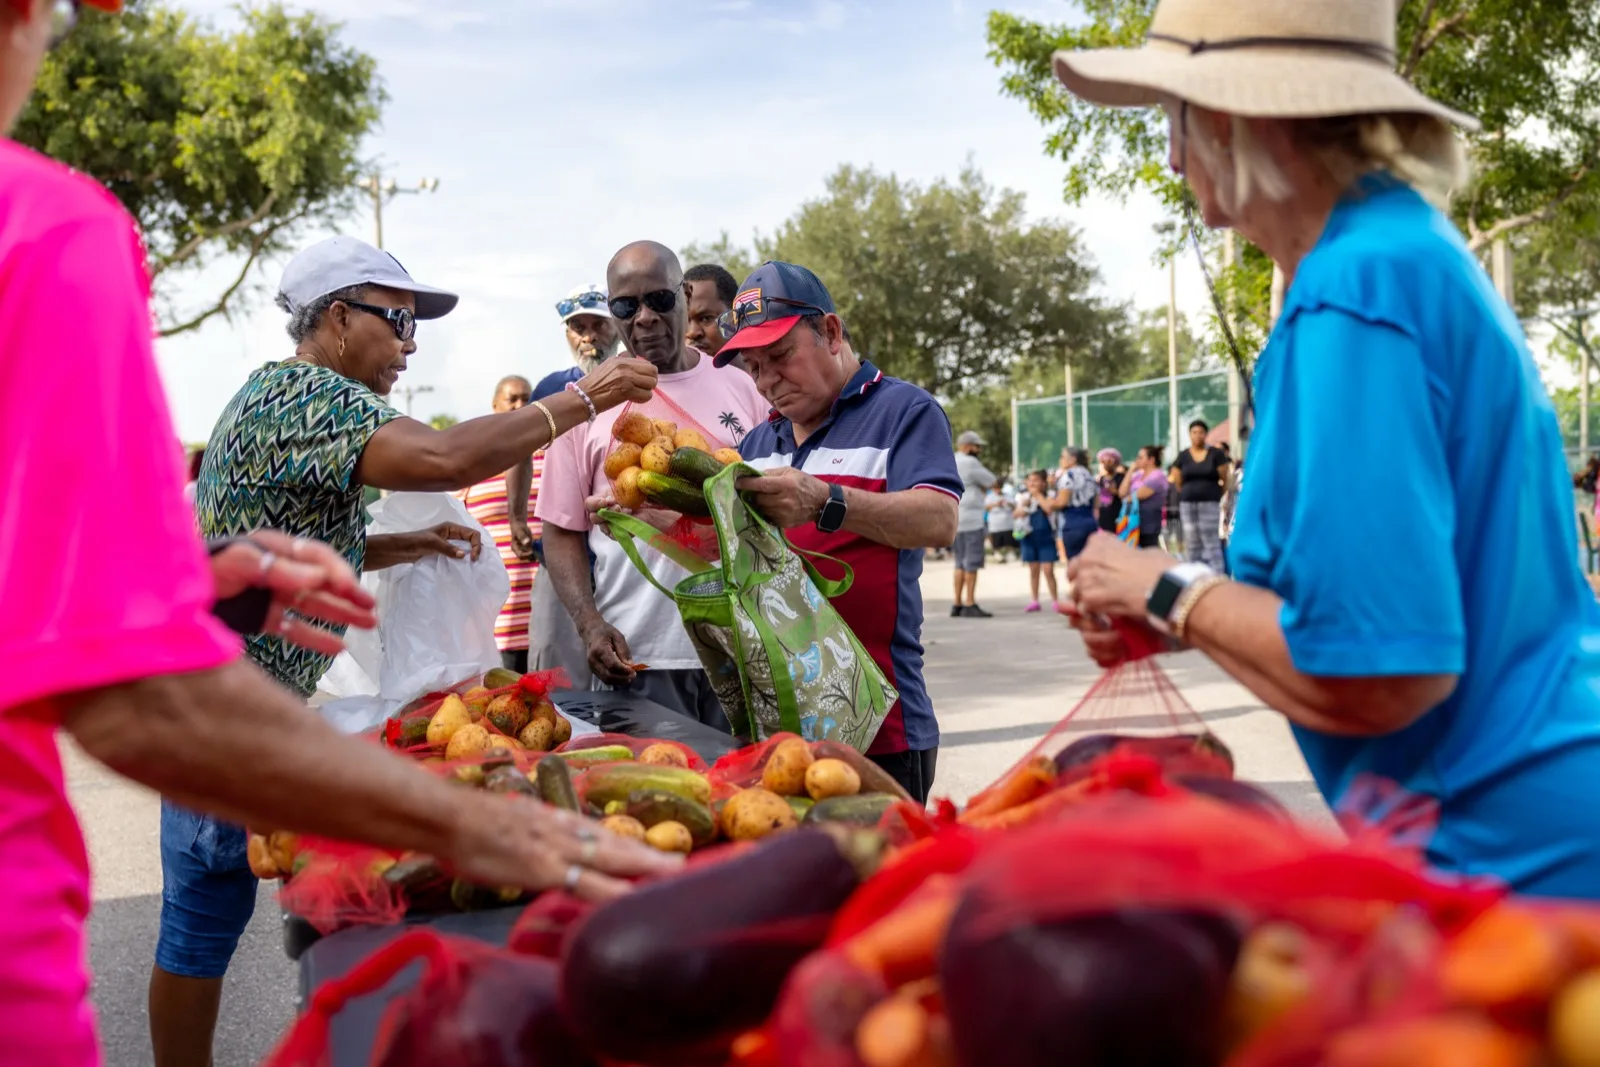
The need is real, and it’s regional. Harry Chapin Food Bank meets it through partner agencies and Mobile Distributions across all five counties, backed by food from grocers, growers, manufacturers, and neighbors throughout Southwest Florida.
A closer look at how that food moves — coming soon in a dedicated “How the Food Bank Works” experience.
Ready to Help — or Get Help?
Whether you need food today or want to stand with your neighbors, there’s a way to take the next step.
Want to give your time instead? Volunteer with us.