The Need
Hunger in Southwest Florida
Across Charlotte, Collier, Glades, Hendry, and Lee counties, neighbors of every kind don’t always know where their next meal is coming from. Here’s what that looks like, county by county — and how Harry Chapin Food Bank responds.
Five counties, one region
Explore the need across Southwest Florida
The map shows two different measures, one at a time: Feeding America’s estimates of how many neighbors may not have enough food (2024 data), and older USDA data on where low-income neighborhoods were far from a large grocery store. Living near a store doesn’t make food affordable, so the two don’t always line up.
Show on the map
Choose an area
Overall food-insecurity rate, 2024 Low-income areas far from a large grocery store
Historical 2019 store locations · 2010 population
Loading the local county map.
- 13.0%–14.9%
- 15.0%–17.9%
- 18.0%–20.9%
- Low-income census tract far from a large grocery store
- Other areas
Large rural tracts look big but have fewer residents; county percentages show the share of people.
Select a county on the map or with the buttons above. Use + and − to zoom; “All five counties” returns to the full region.
All five counties
- Overall food insecurity
- 14.3%
- People facing food insecurity
- 209,780
- Child food insecurity
- —
- Children facing food insecurity
- —
Choose a county to see its child estimates.
Feeding America, Map the Meal Gap 2026 · 2024 data
Historical 2019 store locations · 2010 population
11%
of residents in 2010 had low income and lived more than 1 mile (urban) or 10 miles (rural) from a large grocery store.
47 of 285 census tracts met USDA’s criteria.
USDA ERS Large Retailer Access Map · 2019 store locations, 2010 population, 2014–18 income. Historical, not current conditions.
Compare all five counties in a table
On small screens, scroll the tables sideways to see every column.
| County | Overall rate | People | Child rate | Children | Cost per meal |
|---|---|---|---|---|---|
| Charlotte County | 13.6% | 27,430 | 19.8% | 4,680 | $4.03 |
| Collier County | 13.4% | 53,370 | 19.6% | 12,740 | $4.47 |
| Glades County | 17.5% | 2,200 | 21.1% | 350 | $3.32 (imputed) |
| Hendry County | 19.9% | 8,450 | 20.9% | 2,210 | $3.32 |
| Lee County | 14.5% | 118,330 | 20.3% | 28,500 | $4.07 |
| All five counties | 14.3% | 209,780 | — | — | — |
Cost per meal: Feeding America, Map the Meal Gap 2026 · 2024 data. * For Glades County, the source flags the local meal-cost estimate as imputed.
| County | Low income and far from a large grocery store (share of 2010 residents) | Census tracts meeting USDA’s criteria |
|---|---|---|
| Charlotte County | 14% | 5 of 38 |
| Collier County | 7% | 11 of 73 |
| Glades County | 24% | 3 of 3 |
| Hendry County | 7% | 2 of 6 |
| Lee County | 12% | 26 of 165 |
| All five counties | 11% | 47 of 285 |
Sources & definitions
Food insecurity by county
Food insecurity means a household lacks consistent access to enough food for an active, healthy life. Estimates are from Feeding America, Map the Meal Gap 2026, using 2024 data. Map shading shows the overall rate; child estimates appear in the county details and the table.
Grocery access — historical
From USDA’s Large Retailer Access Map. A shaded census tract met USDA’s low-income criteria and had at least 500 people, or a third of its residents, living more than 1 mile (urban) or 10 miles (rural) from a supermarket, supercenter, or large grocery store. It uses 2019 store locations, 2010 population and tracts, and 2014–18 income data, so it is historical, not a picture of conditions today. It does not mean every resident had low income or lacked a store nearby.
This view measures distance to large grocery stores only. It doesn’t capture affordability, transportation, store prices or quality, smaller stores, farmers markets, online shopping, or food pantries. Areas like these are often called “food deserts”; USDA calls them low-income, low-access areas.
USDA also publishes a newer SNAP-authorized Retailer Access Map (2025 stores). It counts every store that accepts SNAP, including convenience and dollar stores, so it measures something different and isn’t combined with this view. We’ll update this view when USDA publishes a newer large-grocery edition.
USDA ERS Large Retailer Access Map data (opens in a new tab)
Map boundaries
County boundaries come from the U.S. Census Bureau 2025 Cartographic Boundary Files (1:500,000) and are for illustration only.
This map describes community conditions and is not a pantry locator. To find food assistance, use Find Food.
Not One Story
Who Experiences Food Insecurity
Food insecurity looks different from one neighbor to the next. It isn’t limited to any single household type, and it doesn’t mean the same thing for everyone it touches.
- Families with Children Child food-insecurity estimates for each county are in the map details above.
- Seniors Some older neighbors on fixed incomes weigh food against medicine, housing, and other rising costs.
- Working Households Many neighbors who turn to food assistance are employed — food insecurity is not only about unemployment.
- Neighbors Facing a Temporary Crisis A job loss, a medical bill, or a storm can suddenly put food out of reach for a household that has never needed help before.
Beyond Distance
What Makes Food Hard to Reach
A grocery store nearby is only part of the picture. For many neighbors, the barriers are about cost and getting there.
Affordability
Rent, utilities, and medical bills can leave too little for groceries, even when a store is close.
Transportation
Without a reliable car or bus route, a store a few miles away can be out of reach.
Distance & Store Options
In rural areas especially, the nearest full grocery store can be many miles away.
Changing Circumstances
A job loss, a medical event, or reduced hours can shift things quickly.
A Regional Response
How Harry Chapin Food Bank Responds
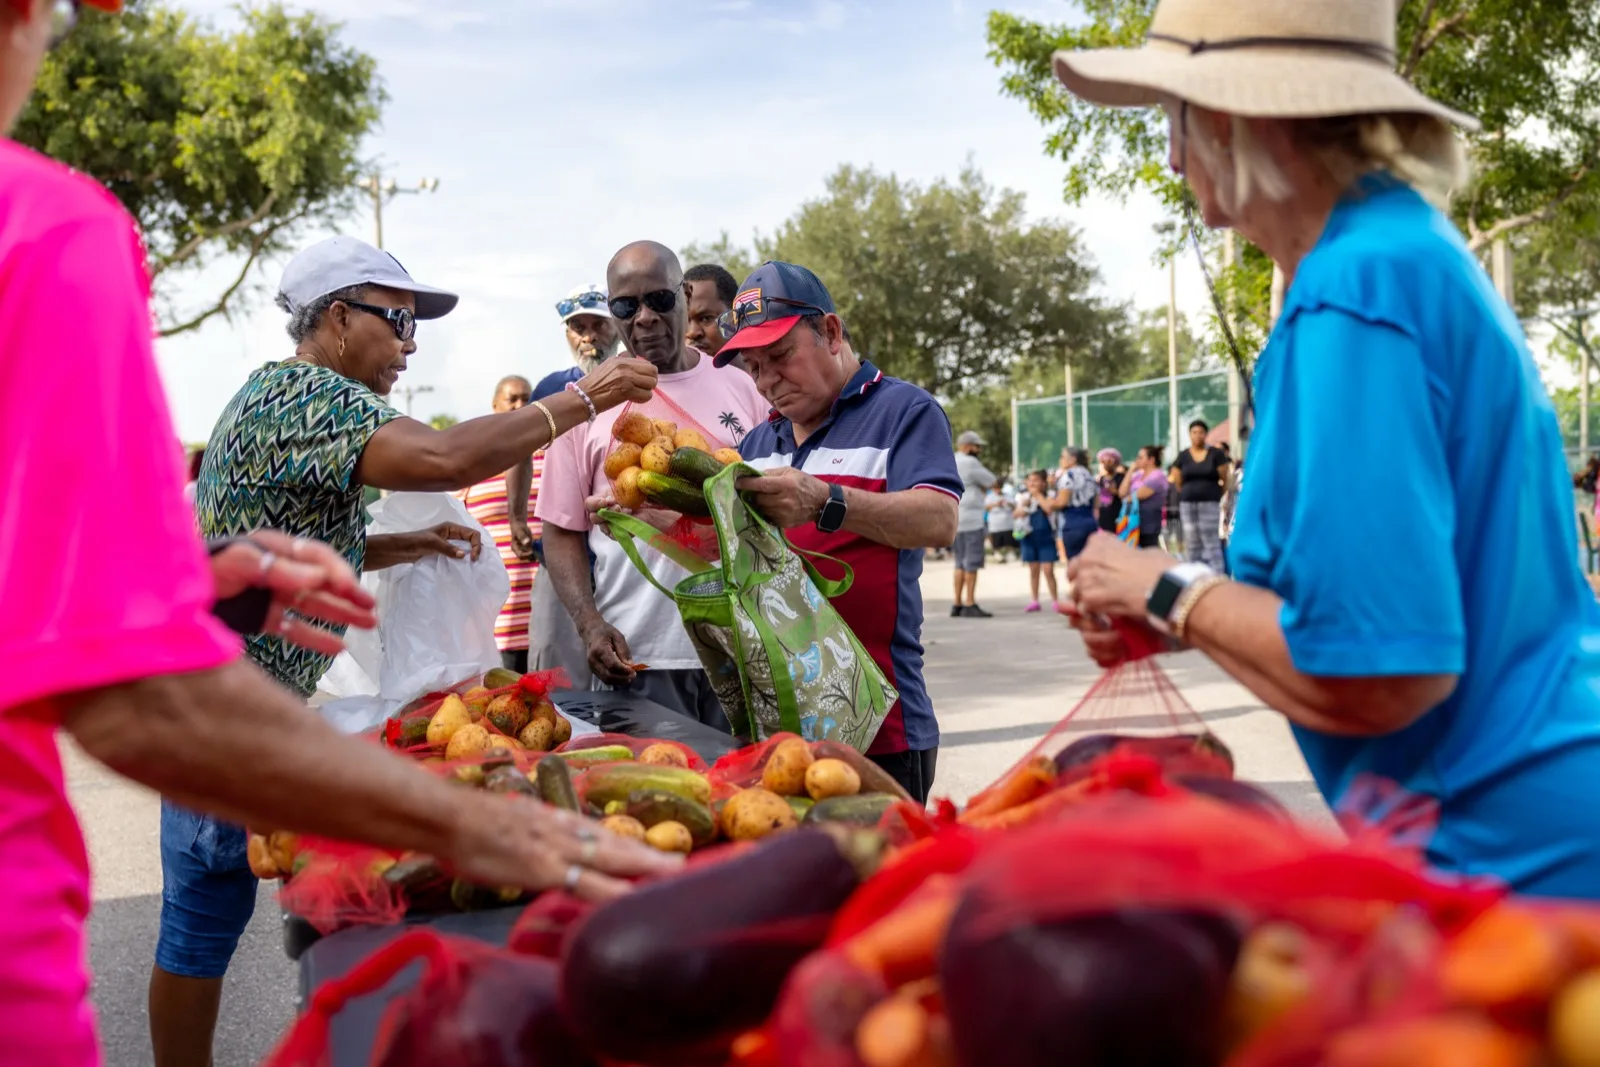
The need is real, and it’s regional. Harry Chapin Food Bank meets it through partner agencies and Mobile Distributions across all five counties, backed by food from grocers, growers, manufacturers, and neighbors throughout Southwest Florida.
Ready to Help — or Get Help?
Whether you need food today or want to stand with your neighbors, there’s a way to take the next step.
Want to give your time instead? Volunteer with us.